Posts

Showing posts from 2023

A new sensor...

I'ver splashed out and picked up a pair of Purple Air Flex air quality monitors. These sensors measure temperature, humidity, pressure, PM2.5 concentrations, and total volatile organic compounds (VOC). (The VOC readings are currently experimental.) The sensor outside data are publically viewable on the purple air map , but the inside sensor data is not disclosed in real time. I will however be doing some experiments with it. One of these days I'll find the ideal sensor package, but until then I just keep collecting!

2023 November

Image
November's weather was more spring like (median temperature 19.3 °C). The HRV was mostly in the cooling season and we openned the windows a fair bit in the evening / night when it was cool out, and the split system was typically cooling during peak solar production. At the end of the month when we had significant rain the dehumidifier ran for a week or so during the day to help dry clothes. Outside temperatures ranged from 10 to 34 °C, while inside we were a comfortable 20.1 to 24.7 °C. Temperature from inside and outside the house as the percentage of hours in 0.5 °C bins. I've scaled the temperature in hope that I will be able to use the temperature range for all months. Methods:  I have taken the 5 minutely data from the wirelessTag sensors and calculated the median temperature for each hour and determined the proportion of hours falling inside of the 20 - 25 °C target temperature (using the R functions 'aggregate' and 'hist'). Inside includes data from

IPHA Open Days -

Image
We had about 20 people visit. Thanks to Andy from Envirotecture , and Trent from Red Cedar Constructions  who were on hand to help with the specialist questions.   The next IPHA Open Days are November 10 - 12th .

2023 October

Image
October's weather alternated between summer and winter with very little time near the average (median temperature 17.3 °C, but low of 8 °C and a high of 36 °C). The HRV flipped between neutral and cooling seasons, and the split system on sparatically cooling during peak solar production. Outside temperatures ranged from 8 to 36 °C, while inside we were a comfortable 18.6 to 24.5 °C. Temperature from inside and outside the house as the percentage of hours in 0.5 °C bins. I've scaled the temperature in hope that I will be able to use the temperature range for all months. Methods: I have taken the 5 minutely data from the wirelessTag sensors and calculated the median temperature for each hour and determined the proportion of hours falling inside of the 20 - 25 °C target temperature (using the R functions 'aggregate' and 'hist'). Inside includes data from the wirelessTag sensors spread across nearly every room of the house. Outside is the data from the wirele

2023 September

Image
September started as winter and finished as summer (median temperature 16.2 °C, but low of 3 °C and a high of 36 °C). The HRV flipped between heating and cooling seasons, and the split system started off the month heating and ended the month cooling during peak solar production. Outside temperatures ranged from 3 to 36 °C, while inside we were a comfortable 18.7 to 26.1 °C. Temperature from inside and outside the house as the percentage of hours in 0.5 °C bins. I've scaled the temperature in hope that I will be able to use the temperature range for all months. Methods: I have taken the 5 minutely data from the wirelessTag sensors and calculated the median temperature for each hour and determined the proportion of hours falling inside of the 20 - 25 °C target temperature (using the R functions 'aggregate' and 'hist'). Inside includes data from the wirelessTag sensors spread across nearly every room of the house. Outside is the data from the wirelessTag sensors

2023 August

Image
August was definitely winter (median temperature 12.5 °C) although we did have a fair number of warmish spring days. The HRV was solidly in the heating season, and the split system was to heat to 23 °C during peak solar production for most of the month. Outside temperatures ranged from 3 to 27 °C, while inside we were a comfortable 18.7 to 24.7 °C. We have opted to keep the house in the World Health Organisation temperature range (> 18 °C) during the heating season because we are very comfortable sleeping with a blanket. Temperature from inside and outside the house as the percentage of hours in 0.5 °C bins. I've scaled the temperature in hope that I will be able to use the temperature range for all months. Methods: I have taken the 5 minutely data from the wirelessTag sensors and calculated the median temperature for each hour and determined the proportion of hours falling inside of the 20 - 25 °C target temperature (using the R functions 'aggregate' and 'hist

2023 July

Image
July was definitely winter (median temperature 12 °C). The HRV was solidly in the heating season, and the split system was to heat to 23 °C during peak solar production for most of the month and to 19 °C over night. Outside temperatures ranged from 1 to 26 °C, while inside we were a comfortable 19.0 to 24.5 °C. We have opted to keep the house in the World Health Organisation temperature range (> 18 °C) during the heating season because we are very comfortable sleeping with a blanket. Temperature from inside and outside the house as the percentage of hours in 0.5 °C bins. I've scaled the temperature in hope that I will be able to use the temperature range for all months. Methods: I have taken the 5 minutely data from the wirelessTag sensors and calculated the median temperature for each hour and determined the proportion of hours falling inside of the 20 - 25 °C target temperature (using the R functions 'aggregate' and 'hist'). Inside includes data from the

2023 June

Image
June was definitely cool and really felt like winter (median temperature 12 °C). The HRV was solidly in the heating season, and the split system was to heat to 23 °C during peak solar production for most of the month. Outside temperatures ranged from 1 to 24 °C, while inside we were a comfortable 18.3 to 24.6 °C. We have opted to keep the house in the World Health Organisation temperature range (> 18 °C) during the heating season because we are very comfortable sleeping with a blanket on the bed. Temperature from inside and outside the house as the percentage of hours in 0.5 °C bins. I've scaled the temperature in hope that I will be able to use the temperature range for all months. Methods: I have taken the 5 minutely data from the wirelessTag sensors and calculated the median temperature for each hour and determined the proportion of hours falling inside of the 20 - 25 °C target temperature (using the R functions 'aggregate' and 'hist'). Inside includes

International Passive House Open Days (mid-year)

Image
We had about 40 people through the house on Saturday morning. Thanks to Andy from Envirotecture , Trent & Garrett from Red Cedar Constructions , and Jason from Logikhaus who were on hand to help with the specialist questions. The next IPHA Open Days are November 10 - 12th .

2023 May

Image
May was definitely cool and really felt like the start of winter (median temperature 12 °C). The HRV was solidly in the heating season after the first week of the month, and the split system was to heat to 23 °C during peak solar production for most of the month. Outside temperatures ranged from 3 to 24 °C, while inside we were a comfortable 18.4 to 24.2 °C. We have opted to keep the house in the World Health Organisation temperature range (> 18 °C) during the heating season because we are very comfortable sleeping with a blanket on the bed. Temperature from inside and outside the house as the percentage of hours in 0.5 °C bins. I've scaled the temperature in hope that I will be able to use the temperature range for all months. Methods: I have taken the 5 minutely data from the wirelessTag sensors and calculated the median temperature for each hour and determined the proportion of hours falling inside of the 20 - 25 °C target temperature (using the R functions 'aggrega

More press...

Another article: Angela Saurine. Sneak peek into Sydney’s first certified passive house. Daily Telegraph / Wentworth Courier. May 9, 2023. The article covers 'light house' in Bronte Gully, the Passive House in Thornleigh, 'the seed house' in Castlecrag, 'pitched perfection' in Greenwich.

2023 April

Image
Inside we were between 20 & 25 °C 100% of the month and we used slightly more energy than we used. April was solidly fall weather with a large number of overcast days... it was definitely summer (median temperature 17 °C). The split system was off the entire month. The HRV was not in a season. Outside temperatures ranged from 9 to 28 °C, while inside we were a comfortable 20.4 to 24.8 °C. We had a few rainly days and a couple of very cloudy weeks. Temperature from inside and outside the house as the percentage of hours in 0.5 °C bins. I've scaled the temperature in hope that I will be able to use the temperature range for all months. Methods: I have taken the 5 minutely data from the wirelessTag sensors and calculated the median temperature for each hour and determined the proportion of hours falling inside of the 20 - 25 °C target temperature (using the R functions 'aggregate' and 'hist'). Inside includes data from the wirelessTag sensors spread across

Open Homes...

Of all the press we have done (which is a fair bit at this point)... this was our fist foray into commercial television. James and the folks at North Light Productions were nice people to deal with, but it was a very differnet beast than working with ABC TV. In case you didn't guess Bondor was the sponsor for the segment on our house. The Passive House aspect didn't really get much coverage, but I do feel like I've said this stuff enough that it is coming out fairly well! Open Homes Australia, season 6, episode 7. YouTube: Open Homes Australia, season 6, episode 7.

2023 March

Image
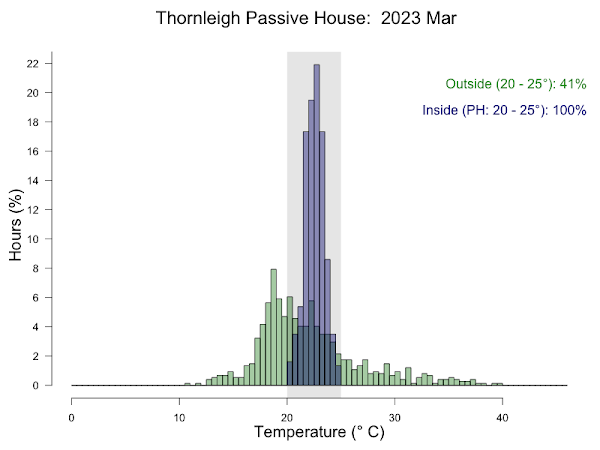
Inside we were between 20 & 25 °C 100% of the month and we produced as much energy as we used (50% direct usage and the other 50% was exported and imported). March started with summer weather but ended in fall weather... it was definitely summer (median temperature 21 °C). The split system was on during peak solar generation for most of the first half of ther month. The HRV was solidly in the 'cooling' season. Outside temperatures ranged from 11 to 40 °C, while inside we were a comfortable 20.0 to 24.8 °C. We had a few rainly days and a couple of very cloudy weeks. Temperature from inside and outside the house as the percentage of hours in 0.5 °C bins. I've scaled the temperature in hope that I will be able to use the temperature range for all months. Methods: I have taken the 5 minutely data from the wirelessTag sensors and calculated the median temperature for each hour and determined the proportion of hours falling inside of the 20 - 25 °C target temperature

2023 February

Image
February had some decently hot weather.. it was definitely summer (median temperature 21 °C). The split system was on during peak solar generation for most of the month and overnight when the temperature did not drop below 20 °C overnight. The HRV was solidly in the 'cooling' season. Outside temperatures ranged from 14 to 38 °C, while inside we were a comfortable 19.6 to 25.5 °C. We had a few rainly days, but it has been mostly sunny. Temperature from inside and outside the house as the percentage of hours in 0.5 °C bins. I've scaled the temperature in hope that I will be able to use the temperature range for all months. Methods: I have taken the 5 minutely data from the wirelessTag sensors and calculated the median temperature for each hour and determined the proportion of hours falling inside of the 20 - 25 °C target temperature (using the R functions 'aggregate' and 'hist'). Inside includes data from the wirelessTag sensors spread across nearly eve

2023 January

Image
January was not been wickedy hot, but it was definitely summer (median temperature 21 °C). The split system was on during peak solar generation for most of the month and overnight when the temperature did not drop below 20 °C overnight. The HRV was solidly in the 'cooling' season. Outside temperatures ranged from 12 to 33 °C, while inside we were a comfortable 19.7 to 25.6 °C. We had a few rainly days, but it has been mostly sunny. Temperature from inside and outside the house as the percentage of hours in 0.5 °C bins. I've scaled the temperature in hope that I will be able to use the temperature range for all months. Methods: I have taken the 5 minutely data from the wirelessTag sensors and calculated the median temperature for each hour and determined the proportion of hours falling inside of the 20 - 25 °C target temperature (using the R functions 'aggregate' and 'hist'). Inside includes data from the wirelessTag sensors spread across nearly every

Bees...

Image
Australia has endemic stingless bees... and now we have some in our yard.  Tetragonula carbonaria are not the European Honey Bees that most people know... they are much smaller and don't have stingers. In the Sydney region, T. carbonaria is at the southern end of its range as they only forage for food at temperatures above 18 °C. Keen observers of this blog will know that for a reasonable period of the year we experience outdoor temperatures below 18 °C. They also do not like temperatures above 38 °C. Outdoor temperature from August 2018 through the end of 2022. You can see that we had a few days in January 2020 that would have been too hot for the bees.  Outdoor temperature from August 2018 through December 2022. The green zone (18 - 38 °C) are temperatures at which the bees will forage. They will have very high mortality at temperatures below 0 °C or above 42 °C. Bees returning to the hive after visiting flowers... The entry to the hive box is through a 1/2 i

2022 December + calendar year 2022

Image
December was relatively mild and comfortable (median temperature °C). We decided to run an experiment in the last half of the month using A/C and no nighttime ventilation. Outside temperatures ranged from 10 to 35 °C, while inside we were a comfortable 20 to 26 °C. Temperature from inside and outside the house as the percentage of hours in 0.5 °C bins. I've scaled the temperature in hope that I will be able to use the temperature range for all months. Methods: I have taken the 5 minutely data from the wirelessTag sensors and calculated the median temperature for each hour and determined the proportion of hours falling inside of the 20 - 25 °C target temperature (using the R functions 'aggregate' and 'hist'). Inside includes data from the wirelessTag sensors spread across nearly every room of the house. Outside is the data from the wirelessTag sensors outside near the cubby house and HRV intake. The water wall and door data are not included. Energy product