Posts

Showing posts with the label electricity

Solar part 3 (upgrade 2)

We have completed the 2nd upgrade to our power system. Our original solar system has: Longi Solar Half Cut Modules (14 x 375W = 5.25kW DC) Degradation profile: < 2% first year,  0.55% years 2-25. Efficiency: 19.5% with Enphase IQ7+ Microinverters (14 x 295W = 4.130 kW AC) Then we added batteries about a year ago: Enphase IQ Battery 5P  (2 x 5kWh = 10 kWh) Now we have topped up the solar system (in preparation for a future EV and to make us net positive in generation across the full year) with: AIKO Solar Neostar 2S (12 × 510W = 6.12kW DC) Degradation profile: < 1% first year,  0.35% years 2-30. Efficiency: 23% with Enphase IQ9 Microinverters (12 x 427W = 5.124kW AC) Enphase IQ Battery 5P (2 x 5kWh = 10 kWh) There are some technicalities in there including both the DC and AC sizing of the two solar arrays. The original panels are on the house roof and tilted 20° towards the sun, whereas the new panels are on the garage roof and tilted 7° away from the sun. This ...

Batteries

Image
We did it. It is not clear that the batteries will save us money, although with the way electrical prices are going, they might, and it isn't clear that they won't save us money either. At some point, we wanted to be part of the solution, so the likely breakeven-ish economics were good enough. Call it an investment in the future stability and sustainability of the Australian electricity grid. In terms of economics. Relative to my last statement on the topic, back in 2021 , four years is a long time. Batteries have gotten better, the cost of electricity is up (and demand pricing has arrived), solar feed-in tariffs are down, and NSW has a battery rebate at the moment. The cost of electricity has become increasingly complicated, making modeling costs/savings more tedious as the costs vary by time of day with times of day changing seasonally. Which also means there are more ways that electricity costs will likely change in the future. Minimally, with the battery system, we shou...

The old house... and some musings on energy usage.

Image
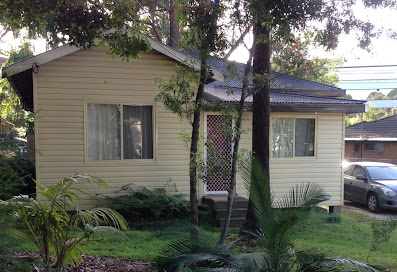
In response to the recent posts on temperature and carbon dioxide in the old house some have asked if it was in fact a tent... so I thought I would share some information on our old house. It was a lot like many of the houses that still exist in Thornleigh. I don't know the year it was built, but it was probably built between WWI and WWII, but had been gutted and renovated circa 1994 (based on the manufacture date printed back of the dry wall).  Originally it would have been two large front rooms and two smaller rooms in the rear with a central hallway plus a front and back porch. Very soon after construction an additional large room was added on the north side of the hallway (as we took the old house down you could see where the window had been). Both porches were filled in and the floors raised to the level of the house during the renovations. The floor plan consisted of 3 bedrooms, a living room, a kitchen/eating area, a bathroom, a laundry closet and a hallway. The total floo...

Heating & power usage...

Image
Heating - how much do we use / need in our house? A simple question, but there are many ways to look at it. I've taken a fairly simplistic. I've used linear models to estimate the effect of temperature on energy usage. The graphical representation of the relation between temperature and energy usage is below...  Some key take aways for people not used to reading graphs: The vertical (y-axis) is daily energy consumption in kilowatts. The horizontal (x-axis) is temperature (in this case it is the running mean operating temperature [RMOT] recorded by the HRV). The dots are 160 individual days - each with a corresponding RMOT and energy consumption reading. The black line is straight and declining - indicating that energy use decreases as temperature increases. In fact for every degree colder we use an extra 0.5kW (this is the slope of the black line). The grey area encompasses 95% of the variation and there is considerable variation. Temperature explains ~ 39% of ...

Electricity Bill

The first quarterly bill for the house with solar fully working... As a reminder we have a solar panel system, but no battery system. On average we used 6.9kWh/day from the grid and returned 7.1 kWh/day to the grid. Between connection fees, electricity costs and rebates our electricity costs were ~ $2/day... for about half of that period all four of us were at home... every... day. While there is a real appeal to a battery system, it will be very hard to make an economic case for one when the potential savings is ~ $1.40 per day. At least until the cost for a ~7kW battery system comes down to ~$5114 (assuming a 10 year payback).

Solar...

As of February the solar is finally installed and working as it should have been back in August. It was a major drama to get the solar panels installed due to the SIP roofing. Apparently most solar installs involve driving bolts through the roof into the building frame... But we don't have a building frame, the SIP is our air tight layer, not to mention we don't want a bunch of thermal bridges. It took contracts with two different companies (not being a standard install was too much for most companies contacted about the installation), and eventually it took two install attempts by the second company when the first bracket they tried did not fit as required. The very big tree that shades our roof made it a bit hard to predict the generation capacity, but our 5.22kW system is generating power that would be expected from an unshaded ~ 4kW system (~ 17kWh / day). Which more than offsets our typical consumption ~ 7kWh / day. Once we have enough data I'll post a more detailed ...