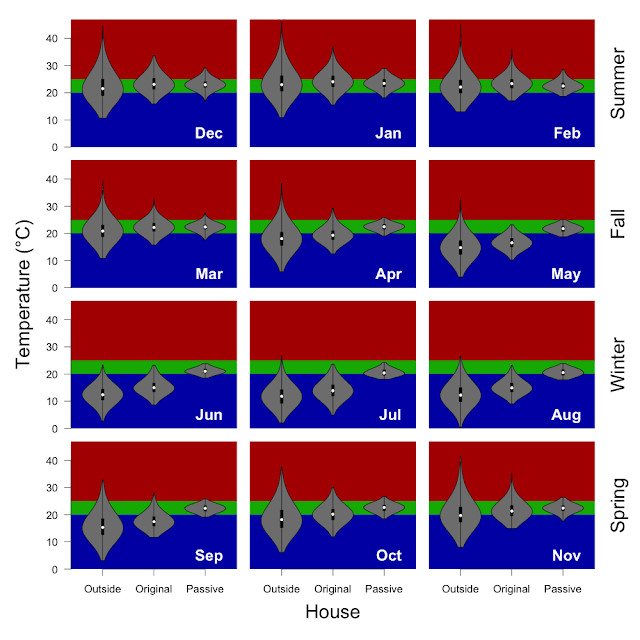
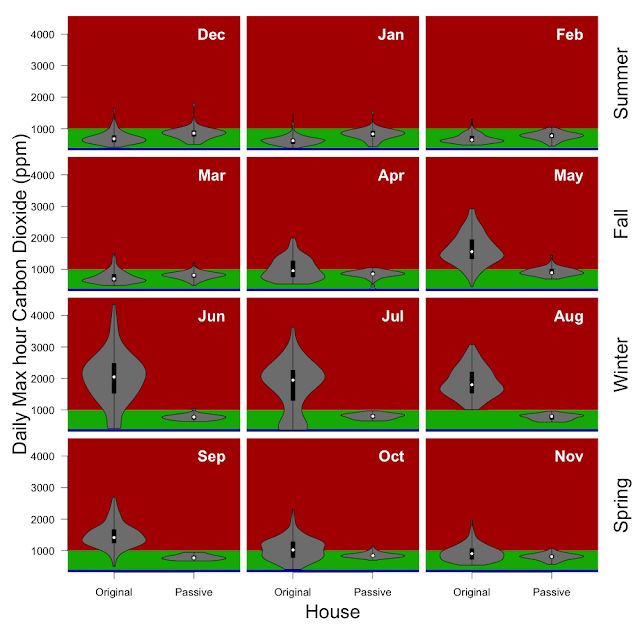
Data for the period during which we have occupied the house and had the sensors working (September 22 - December 31, 2019).
| Inside / Outside | % < 20 °C | % 20 - 25 °C | % > 25 °C |
|---|
| Inside | 4 | 84 | 12 |
| Outside | 55 | 25 | 21 |
Methods: I have taken the 5 minutely data from the wirelessTag sensors and calculated the median temperature of each sensor for each hour and determined the proportion of hours falling inside of the 20 - 25 °C target temperature (using the R functions 'aggregate' and 'hist'). Inside includes data from wirelessTag sensors spread across every room of the house as indicated below. Outside includes data from the wirelessTag sensors in the cubby house, outside, and HRV intake. Sensors from the water wall, clerestory, HRV-outlet and door data are not included in the summary.
Temperatures from sensors deemed indicative of outside conditions...
| Outside sensor name | Min | 5% | 25% | Median | 75% | 95% | Max |
|---|
| CubbyHouse | 5.9 | 11 | 16 | 19.4 | 24.3 | 33.3 | 44 |
| HRV-Intake | 9.6 | 14.1 | 17.7 | 20.1 | 23.7 | 31.2 | 42 |
| Outdoor | 4.5 | 10.5 | 15.7 | 18.9 | 23.2 | 31.6 | 41 |
Temperatures from sensors deemed indicative of inside conditions...
| Inside sensor name | Min | 5% | 25% | Median | 75% | 95% | Max |
|---|
| Mufraj | 18.5 | 20 | 21.2 | 22.4 | 23.7 | 25.8 | 28.9 |
| UpstairsHall | 18.8 | 21 | 22.2 | 23.2 | 24.6 | 26.3 | 29.3 |
| BedroomNorthCentre | 19.2 | 20.3 | 21.5 | 22.7 | 23.9 | 25.9 | 28.1 |
| BedroomNorthWest | 17.8 | 20.4 | 22.1 | 23.3 | 24.5 | 26.6 | 30.4 |
| BedroomSouthEast | 19.4 | 20.8 | 22.2 | 23.2 | 24.5 | 26.4 | 29.8 |
| exhaustBathUp | 19.3 | 20.5 | 21.9 | 23 | 24.3 | 26.2 | 29.6 |
| exhaustMaster | 19.2 | 20.2 | 21.5 | 22.6 | 23.8 | 25.9 | 29.4 |
| Kitchen | 18.1 | 19.9 | 21.1 | 22.1 | 23.3 | 25.1 | 28.6 |
| Study | 18.2 | 19.7 | 21 | 22.1 | 23.3 | 25.3 | 29.7 |
| WaterWallAir | 19.3 | 20.5 | 21.4 | 22.2 | 23.1 | 25 | 27.8 |
| exhaustBathDown | 17.3 | 20 | 21.4 | 22.5 | 23.7 | 25.7 | 28.7 |
| exhaustLaundry | 18.8 | 20.5 | 22 | 23.1 | 24.4 | 26.9 | 30.9 |
Temperatures from water wall sensors (excluded from summary stats)...
| sensor name | Min | 5% | 25% | Median | 75% | 95% | Max |
|---|
| WaterWallEast | 20.5 | 21.4 | 22.1 | 22.7 | 23.4 | 25.2 | 27.4 |
| WaterWallWest | 20 | 21 | 21.7 | 22.4 | 23.1 | 25 | 27.3 |
Temperatures from other sensors not deemed to be reflective of general house or outside temperatures...
| sensor name | Min | 5% | 25% | Median | 75% | 95% | Max |
|---|
| Clerestory | 18 | 19.7 | 21.4 | 22.7 | 24.3 | 26.8 | 31.5 |
| DoorLaundry | 18.3 | 19.7 | 21.3 | 22.6 | 24.1 | 26.7 | 32.4 |
| HRV-Outlet | 14.2 | 19.5 | 21.6 | 23 | 24.8 | 29.7 | 40 |
Methods: I have taken the ~ 5 minutely data from the wirelessTag sensors and calculated the median temperature of each sensor for each hour and determined the indicated quantiles for each sensor (using the R functions 'aggregate' and 'quantile'). So 25% of the hours have a temperature less than listed in column "25%", and so on... Ninety percent of the recorded hours are between the value listed in column 5% and column 95%. Not all sensors were deployed for the entire time period - see other blog posts about when various sensors were placed. Some sensors have gaps on the order of a day or two between when batteries die and when they are replaced.


