2020 February
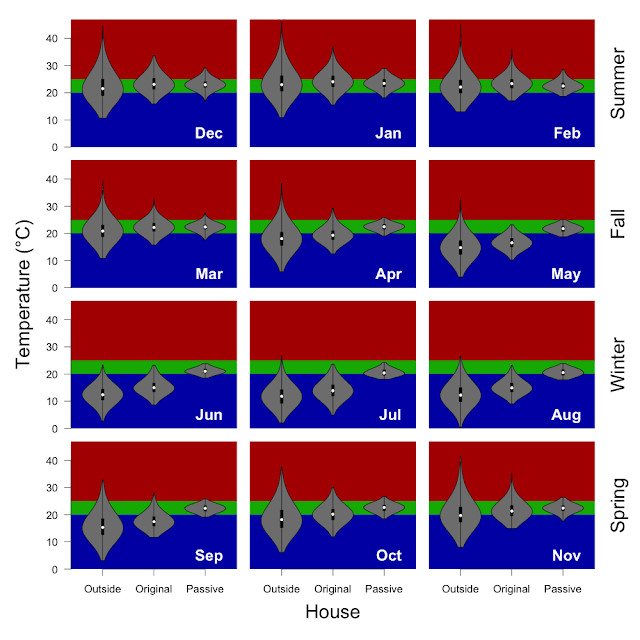
The A/C was rarely this month, mainly when night time temperatures didn't drop or when the day time temperatures climbed into the mid-40's... still haven't written the A/C script. For the record: 28 °C inside feels really good when it is 43 °C. The cubby house sensor got wet during the big storm and is no longer reporting data.
| Inside / Outside | % < 20 °C | % 20 - 25 °C | % > 25 °C |
|---|---|---|---|
| Inside | 3 | 83 | 14 |
| Outside | 37 | 44 | 19 |
Methods: I have taken the 5 minutely data from the wirelessTag sensors and calculated the median temperature of each sensor for each hour and determined the proportion of hours falling inside of the 20 - 25 °C target temperature (using the R functions 'aggregate' and 'hist'). Inside includes data from 12 wirelessTag sensors spread across every room of the house. Outside is the data from the wirelessTag sensors in the cubby house, outside, and HRV intake. The water wall, clerestory and door data are not included.
| Inside / Outside | Min | 5% | 25% | Median | 75% | 95% | Max |
|---|---|---|---|---|---|---|---|
| Inside | 19 | 20 | 22 | 23 | 24 | 26 | 28 |
| Outside | 14 | 17 | 19 | 21 | 24 | 25 | 43 |
Methods: I have taken the 5 minutely data from the wirelessTag sensors and calculated the median temperature of each sensor for each hour and determined the indicated quantiles for each sensor (using the R functions 'aggregate' and 'quantile'). Inside includes data from 12 wirelessTag sensors spread across every room of the house. Outside is the data from the wirelessTag sensors in the cubby house, outside, and HRV intake. The water wall, clerestory and door data are not included.


