2020 April
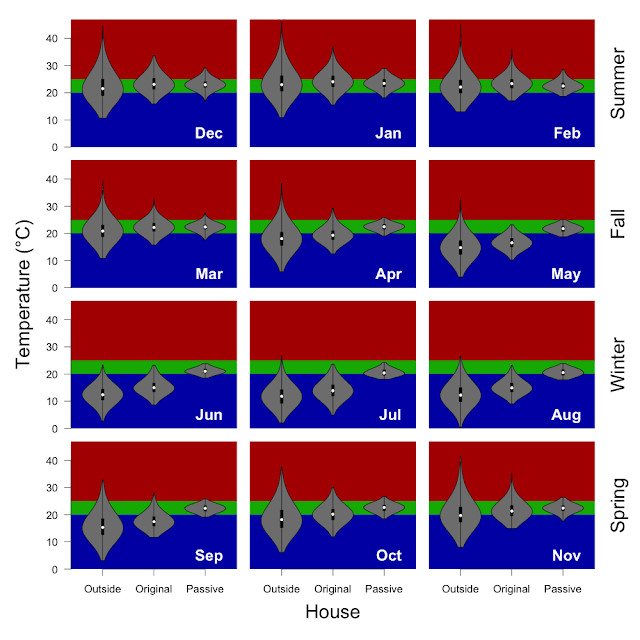
Another month of house data... The weather was mostly nice, with enough rain for almost normal moisture back in the system and enough cloud to reduce our solar generation. Of course the big news this month is still COVID-19 (2 adults + 2 children) at home... all... of... the... time... and we are not too crazy yet. As the season has changed I have moved the HRV target temperature up higher to 21 °C and then to 23 °C at the very end of the month. The need for nighttime cooling appears to be behind us, and we would have hit 100% of hours in the target range except for not quite managing the changing of target temperatures in changing weather.
| Inside / Outside | % < 20 °C | % 20 - 25 °C | % > 25 °C |
|---|---|---|---|
| Inside | 0% | 98% | 2% |
| Outside | 74% | 22% | 4% |
Methods: I have taken the 5 minutely data from the wirelessTag sensors and calculated the median temperature of each sensor for each hour and determined the proportion of hours falling inside of the 20 - 25 °C target temperature (using the R functions 'aggregate' and 'hist'). Inside includes data from 12 wirelessTag sensors spread across every room of the house. Outside is the data from the wirelessTag sensors outside near the cubby house and HRV intake. The water wall, clerestory and door data are not included.
| Inside / Outside | Min | 5% | 25% | Median | 75% | 95% | Max |
|---|---|---|---|---|---|---|---|
| Inside | 20 | 21 | 22 | 23 | 23 | 25 | 25 |
| Outside | 8 | 10 | 14 | 17 | 21 | 25 | 30 |
Methods: I have taken the 5 minutely data from the wirelessTag sensors and calculated the median temperature of each sensor for each hour and determined the indicated quantiles for each sensor (using the R functions 'aggregate' and 'quantile'). Inside includes data from 12 wirelessTag sensors spread across every room of the house. Outside is the data from the wirelessTag sensors in the cubby house, outside, and HRV intake. The water wall, clerestory and door data are not included.
Monthly electricity data. We were net energy users for the month (22.7kWh net use, or 0.76kWh/day). Because we don't have batteries, we exported 185.9kWh and imported 208.6kWh.
| Quantile | Energy Produced (kWh/day) | Energy Net (kWh/day) |
|---|---|---|
| Min | 2.00 | -9.56 |
| Median | 13.39 | 0.67 |
| Max | 18.71 | 6.24 |
Methods: I have taken the 15 minutely data from the Enphase Enlighten website summed by day and determined the indicated quantiles (using the R functions 'aggregate' and 'quantile'). Energy produced and Energy Produced - Energy Consumed. Note: this only measures indoor electricity usage (doesn't include the rainwater tank pump, the garage door, or the garage lights) because the solar is tied into the inside distribution panel not the meter.


