Posts

2021 December

Image
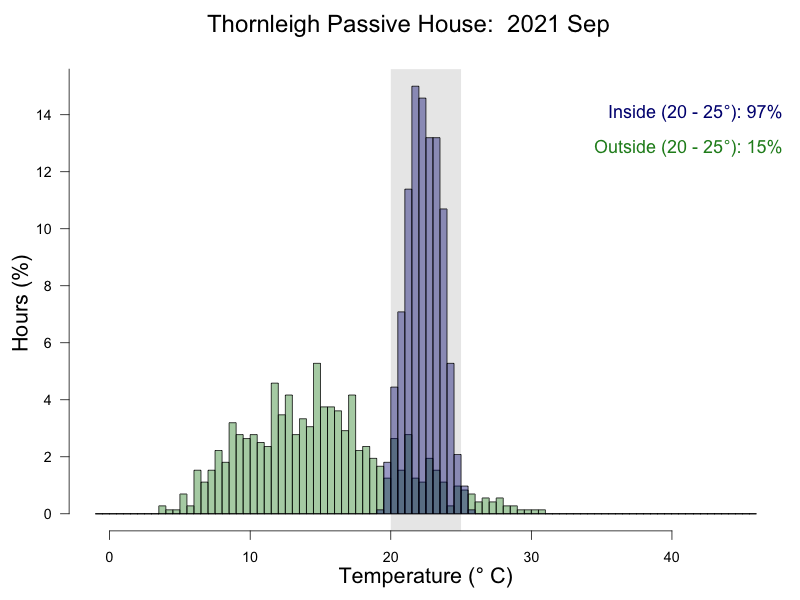
December and the new normal. The split system was on an automatic mode most of the month (cooling from 10:00 - 18:15) and the HRV was solidly in 'cooling season'. The HRV did a great job of keeping the house in the comfort zone. The kids were in school for the first half of the month and the parents are were in the office a few days a week, but we were mostly at home... again. Temperature from inside and outside the house as the percentage of hours in 0.5 °C bins. I've scaled the temperature in hopes that they will be comparable across months. Methods: I have taken the 5 minutely data from the wirelessTag sensors and calculated the median temperature for each hour and determined the proportion of hours falling inside of the 20 - 25 °C target temperature (using the R functions 'aggregate' and 'hist'). Inside includes data from the wirelessTag sensors spread across nearly every room of the house. Outside is the data from the wirelessTag sensors outside ...

2021 November (+ Spring)

Image
New normal version 2.0 for November: kids in School and the parents working from home ~4 days per week. The split system was off for the entire month and the HRV slid in and out of 'cooling season' and neutral modes of operation more times that I could keep track of. The HRV did a great job of keeping the house in the comfort zone (if I could set the cooling season trigger in half degree increments we would have bit in range a bit more). It was an abnormally wet and cool November. Temperature from inside and outside the house as the percentage of hours in 0.5 °C bins. I've set the temperature range in hopes that they will be comparable across months. Methods: I have taken the 5 minutely data from the wirelessTag sensors and calculated the median temperature for each hour and determined the proportion of hours falling inside of the 20 - 25 °C target temperature (using the R functions 'aggregate' and 'hist'). Inside includes data from the wirelessTag sen...

2021 October

Image
Lockdown version 2.0 came to an end at the very end of October. The split system was off for most of the month (six days with heat and one day with cooling) and the HRV slid in and out of 'cooling season' and neutral modes of operation more times that I could keep track of. The HRV did a great job of keeping the house in the comfort zone. The kids went back to school for the last week of the month and the parents are were in the office a few days at the end of the month, but we were mostly at home... again. Temperature from inside and outside the house as the percentage of hours in 0.5 °C bins. I've scaled the temperature in hopes that they will be comparable across months. Methods: I have taken the 5 minutely data from the wirelessTag sensors and calculated the median temperature for each hour and determined the proportion of hours falling inside of the 20 - 25 °C target temperature (using the R functions 'aggregate' and 'hist'). Inside includes data...

2021 September

Image
Spring is underway, but so is lockdown version 2.0. The flowers are out, but we are not. In September the split system was off for most of the month and the HRV slid in and out of 'heating season' and neutral modes of operation more times that I could keep track of. The HRV is working well and doing a great job of keeping the house in the comfort zone. During September we were all at home in our second significant COVID lockdown (and going a bit crazy). I continuing the graphic heavy format. Temperature from inside and outside the house as the percentage of hours in 0.5 °C bins. I've scaled the temperature in hopes that they will be comparable across months. Methods: I have taken the 5 minutely data from the wirelessTag sensors and calculated the median temperature for each hour and determined the proportion of hours falling inside of the 20 - 25 °C target temperature (using the R functions 'aggregate' and 'hist'). Inside includes data from the wire...

Sustainable House Day 2021 & Year 2 - numbers update...

[ In progress ] With the anniversary of moving in and sustainable house day coming up... I need to start running some numbers. I am also creating my annual index to posts so that I can find them when doing sustainable house day stuff! Power generation and usage... June 2021 old house and energy April 2021 energy musings (including battery) Water usage... Aug 2021 water update Dec 2020 HRV thoughts... Aug 2021 second guessing ERV Dec 2020 HRV in Sydney post Temperature & CO2... June 2021 Temperature analysis & plots June 2021 CO2 analysis & plots Air tightness July 2021 update

Water update...

Image
It has been a while since I've done a water update... Sydney Water: based on data from the last 8 water bills we have used 122kL over 646 days or an average of 189L/day. We have four people living here so individually we average 47 L/day. Comparing those numbers is a little tricky. Sydney Water data indicates that an average dwelling uses 623L/day . They also provide water efficiency targets by season , number of people and property size. For our property the comparison is > 900m² with 4 people. Sydney Water efficiency targets by quarter (L/day). Quarter Sydney Water Target TPH actual Aug - Oct 556 253 Nov - Jan 572 195 Feb - Apr 576 187 May - Jul 535 167 Despite by best intentions I have not yet put into place the software to measure the rain water tank usage directly, but I do have a system that measures the water height in the tank (Vegetronics) and a NetAtmo rain gauge.  The rainwater tank sensor reports full slightly below the actual full mark, so there...

2021 August (+ Winter)

Image
Winter is done, but lockdown version 2.0 is not. In August the split system ran as a heater for most of the month from ~9:45am until 3:30pm, scheduled to take advantage of the solar production during that part of the day. On cooler nights we kept it on set to 19 °C. The HRV is working well and doing a great job of keeping the house in the comfort zone, although the gound floor is consistently a few degrees cooler than the top floor. During August we were all at home in our second significant COVID lockdown (and going a bit crazy). I am going to change to a more graphic heavy format. Temperature from inside and outside the house as the percentage of hours in 0.5 °C bins. I've scaled the temperature in hopes that they will be comparable across months. Methods: I have taken the 5 minutely data from the wirelessTag sensors and calculated the median temperature for each hour and determined the proportion of hours falling inside of the 20 - 25 °C target temperature (using the ...