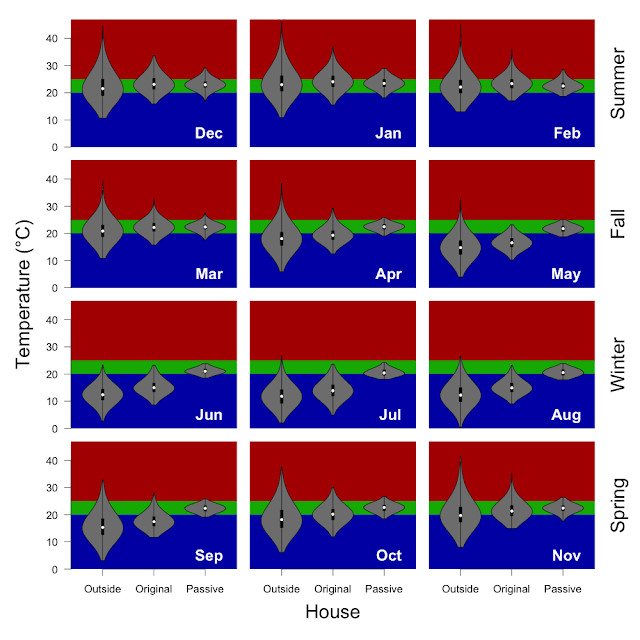
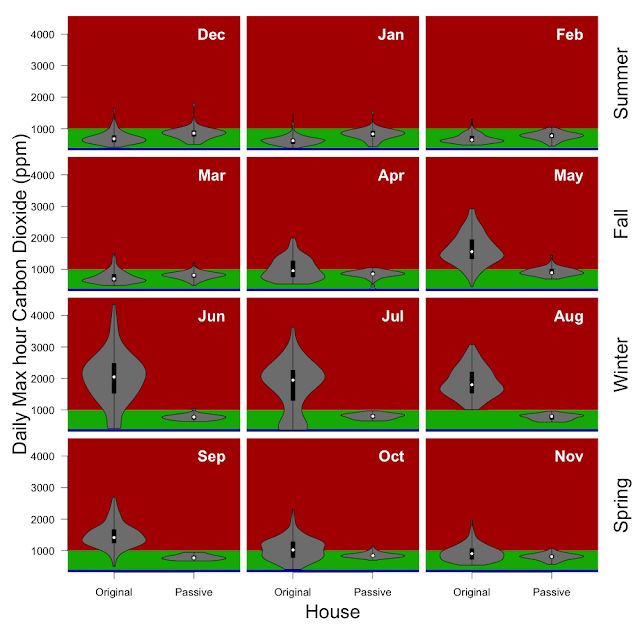
The sensors have now been set up for over a month (since the 22nd of September), so this "October temperature summary" includes all the data between September 23rd and October 31. This month we were still learning how to best manage the house, with some operator oversights that could have improved these numbers a bit (i.e., remembering to lower the blind, opening windows for night ventilation, and picking the best HRV settings). But I think the numbers still look good.
At no point during the period covered by these data was any additional heating or air-condition used.
Methods: I have taken the 5 minutely data from the wirelessTag sensors and calculated the median temperature of each sensor for each hour and determined the proportion of hours falling inside of the 20 - 25 °C target temperature (using the R functions 'aggregate' and 'hist'). Inside is the data from the wirelessTag sensors in the Kitchen, Mufraj, Master and centre bedrooms. Outside is the data from the wirelessTag sensors in the cubby house and outside. The water wall data is only began on the 24th of October.
| Inside / Outside | % < 20 °C | % 20 - 25 °C | % > 25 °C |
|---|
| Inside | 17 | 79 | 5 |
| Outside | 69 | 17 | 14 |
| sensor name | % < 20 °C | % 20 - 25 °C | % > 25 °C |
|---|
| CubbyHouse | 68 | 17 | 15 |
| Outside | 70 | 18 | 12 |
| Kitchen | 10 | 88 | 2 |
| Master bedroom | 8 | 90 | 2 |
| Centre bedroom | 4 | 92 | 4 |
| Mufraj | 7 | 90 | 3 |
| WaterWall East | 0 | 94 | 6 |


