2020 June
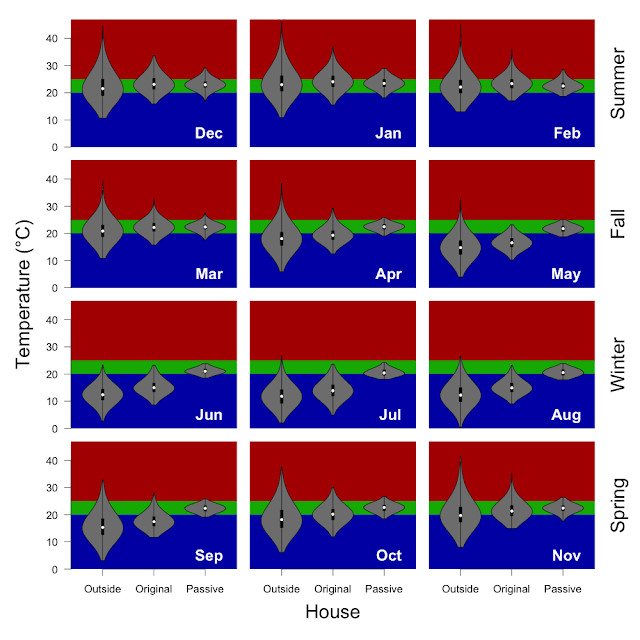
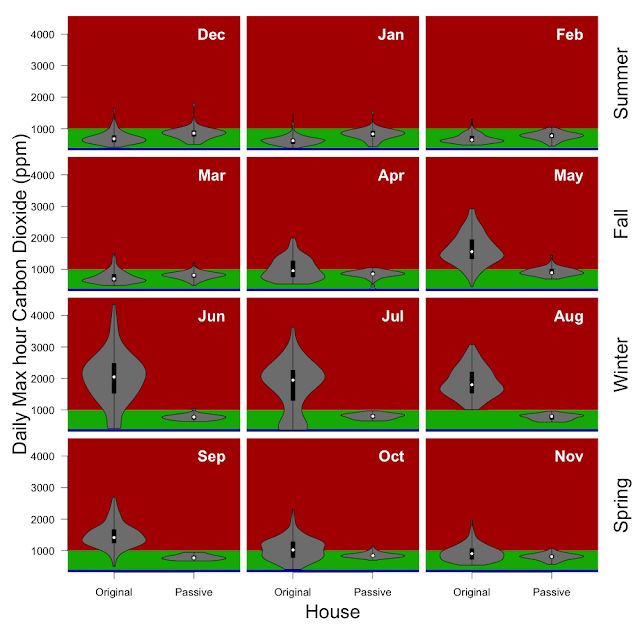
Another month of house data... The weather is getting down right cold, with lots of modest rainfall. Of course the big news this month was still COVID-19 (2 adults working from home except for a couple of days towards the end of the month), but the kids were back to school all month. We have even run the heater a fair bit to bring the house temperature up just a bit. We were using the ERV core all month as our part of data collection on the two cores in the Sydney climate.
| Inside / Outside | % < 20 °C | % 20 - 25 °C | % > 25 °C |
|---|---|---|---|
| Inside | 14% | 85% | 1% |
| Outside | 100% | 0% | 0% |
Methods: I have taken the 5 minutely data from the wirelessTag sensors and calculated the median temperature of each sensor for each hour and determined the proportion of hours falling inside of the 20 - 25 °C target temperature (using the R functions 'aggregate' and 'hist'). Inside includes data from 12 wirelessTag sensors spread across every room of the house. Outside is the data from the wirelessTag sensors outside near the cubby house and HRV intake. The water wall, clerestory and door data are not included.
| Inside / Outside | Min | 5% | 25% | Median | 75% | 95% | Max |
|---|---|---|---|---|---|---|---|
| Inside | 19 | 20 | 21 | 21 | 22 | 23 | 24 |
| Outside | 3 | 6 | 8 | 12 | 14 | 18 | 20 |
Methods: I have taken the 5 minutely data from the wirelessTag sensors and calculated the median temperature of each sensor for each hour and determined the indicated quantiles for each sensor (using the R functions 'aggregate' and 'quantile'). Inside includes data from 12 wirelessTag sensors spread across every room of the house. Outside is the data from the wirelessTag sensors in the cubby house, outside, and HRV intake. The water wall, clerestory and door data are not included.
Monthly electricity data. We generated 374kWh , we used 453kWh, so we were net energy users for the month (2.6kWh/day). Because we don't have batteries, we exported 190.5kWh and imported 269.2kWh. Part of this is running the heater (~ 1.5kWh/day), part of this is winter equals shorter days and weaker sun, but the overcast conditions also contributed (In both May and June we generated ~12.5 kWh/day). A back of the envelope estimate on heater usage above is based on overall usage of 15kWh/day in June versus 13.5kWh/day in May, but stay tuned for a deeper dive into the electricity data...


