Sustainable House Day 2020 - numbers update...
This is mainly a way for me to put some numbers down so that I have them on Sunday for the Sustainable House Day panel...
- Sustainable House Day 2020 entry.
- Original solar blog post (2020.Feb.29).
- Power and heating blog post (2020.Aug.25).
- Latest water usage blog post (2020.Jul.15).
- Night time ventilation blog post (2019.Oct.25).
- Carbon dioxide and HRV blog post (2019.Oct.01).
| Category | Total | Daily |
|---|---|---|
| Produced | 2.7 MWh | 13.2 kWh |
| Consumed | 2.8 MWh | 13.7 kWh |
| Export | 1.4 MWh | 7.4 kWh |
| Import | 1.5 MWh | 6.9 kWh |
| Net Import | 97 khW | 475 Wh |
Because of the way the property is wired these numbers only include the house usage, excluding the garage / rainwater tank pump (which are minor).
| Inside / Outside | % < 20 °C | % 20 - 25 °C | % > 25 °C |
|---|---|---|---|
| Inside | 7% | 85% | 7% |
| Outside | 70% | 20% | 10% |
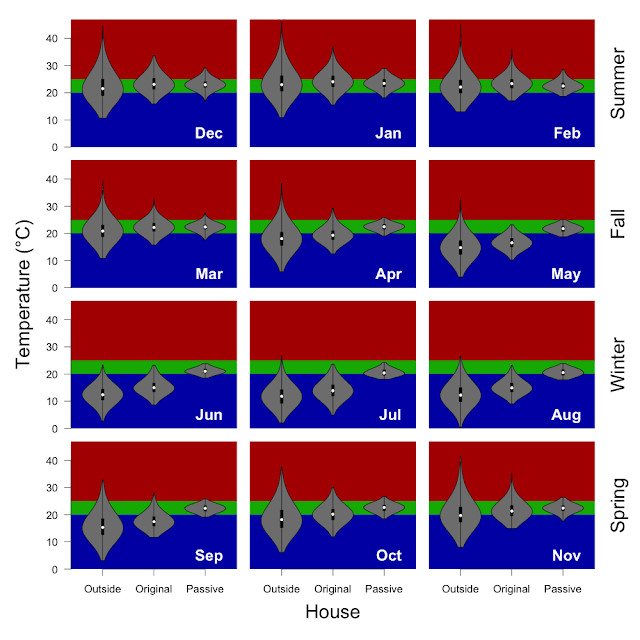
Methods: I have taken the 5 minutely data from the wirelessTag sensors and calculated the median temperature of each sensor for each hour and determined the proportion of hours falling inside of the 20 - 25 °C target temperature (using the R functions 'aggregate' and 'hist'). Inside includes data from 12 wirelessTag sensors spread across every room of the house. Outside is the data from the wirelessTag sensors outside near the cubby house and HRV intake. The water wall, clerestory and door data are not included.
| Inside / Outside | Min | 5% | 25% | Median | 75% | 95% | Max |
|---|---|---|---|---|---|---|---|
| Inside | 18 | 20 | 21 | 22 | 23 | 25 | 29 |
| Outside | 2 | 8 | 12 | 17 | 21 | 29 | 42 |
Methods: I have taken the 5 minutely data from the wirelessTag sensors and calculated the median temperature of each sensor for each hour and determined the indicated quantiles for each sensor (using the R functions 'aggregate' and 'quantile'). Inside includes data from 12 wirelessTag sensors spread across every room of the house. Outside is the data from the wirelessTag sensors in the cubby house, outside, and HRV intake. The water wall, clerestory and door data are not included.


