2020 October
Always easier when the first day of the month is on a Sunday! On it with the report this month. The revised scripts are helping with the turnaround time too. By way of a random COVID update... One adult is working from home 5 days a week and the other is at home about half the week, but the kids are in school.
| Inside / Outside | % < 20 °C | % 20 - 25 °C | % > 25 °C |
|---|---|---|---|
| inside | 1% | 96% | 2% |
| outside | 73% | 17% | 10% |
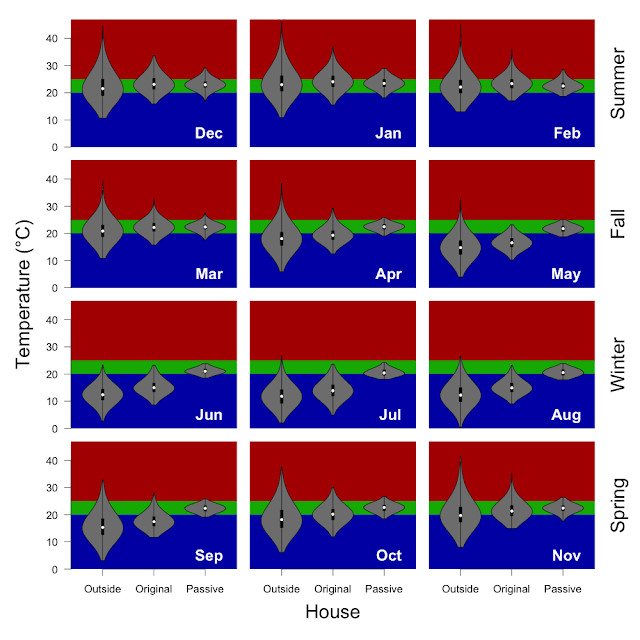
Methods: I have taken the 5 minutely data from the wirelessTag sensors and calculated the median temperature for each hour and determined the proportion of hours falling inside of the 20 - 25 °C target temperature (using the R functions 'aggregate' and 'hist'). Inside includes data from 12 wirelessTag sensors spread across every room of the house. Outside is the data from the wirelessTag sensors outside near the cubby house and HRV intake. The water wall and door data are not included.
| Inside / Outside | Min | 5% | 25% | Median | 75% | 95% | Max |
|---|---|---|---|---|---|---|---|
| inside | 20 | 21 | 22 | 23 | 24 | 25 | 26 |
| outside | 8 | 12 | 14 | 17 | 20 | 27 | 33 |
Methods: I have taken the 5 minutely data from the wirelessTag sensors and calculated the median temperature for each hour and determined the indicated quantiles for each sensor (using the R functions 'aggregate' and 'quantile'). Inside includes data from 12 wirelessTag sensors spread across every room of the house. Outside is the data from the wirelessTag sensors in the cubby house, outside, and HRV intake. The water wall and door data are not included.
Monthly electricity data. We generated 471kWh, we used 360kWh, so we were net energy producers for the month (3.6kWh/day). Because we don't have batteries, we exported 276kWh and imported 164kWh.


