2020 November
The end of the calendar year is creeping up fast. The revised scripts are helping with the turnaround time. By way of a random COVID update... On average one adult is working from home five days a week and the other is at work, but the kids are in school.
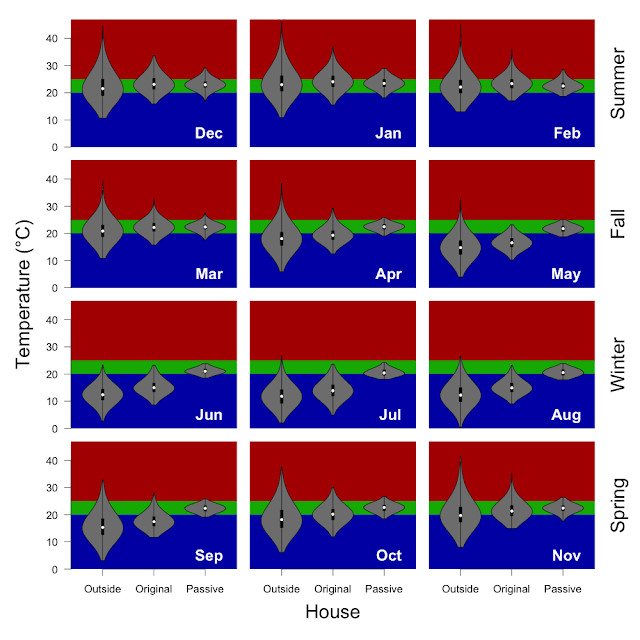
We set records for overnight temperatures on the last weekend of the month with our outdoor overnight temperature staying above 27 °C and the daily high on either side hitting 40 °C. While we normally turn off the A/C at 6pm every night (scheduled to align loosely with the end of solar generation) we left the A/C on overnight. Across the two days we ended up using ~ 1kW/day more than we generated do to higher A/C usage than normal, but the house temperature stayed a comparatively comfortable ~ 26 °C even when the outside temperatures were clearing 40 °C with no chance for openning the windows for nighttime ventilation to cool the house.
| Inside / Outside | % < 20 °C | % 20 - 25 °C | % > 25 °C |
|---|---|---|---|
| inside | 0% | 93% | 7% |
| outside | 58% | 24% | 18% |
Methods: I have taken the 5 minutely data from the wirelessTag sensors and calculated the median temperature for each hour and determined the proportion of hours falling inside of the 20 - 25 °C target temperature (using the R functions 'aggregate' and 'hist'). Inside includes data from 12 wirelessTag sensors spread across every room of the house. Outside is the data from the wirelessTag sensors outside near the cubby house and HRV intake. The water wall and door data are not included.
| Inside / Outside | Min | 5% | 25% | Median | 75% | 95% | Max |
|---|---|---|---|---|---|---|---|
| inside | 20 | 21 | 22 | 23 | 24 | 25 | 26 |
| outside | 8 | 12 | 16 | 19 | 23 | 33 | 40 |
Methods: I have taken the 5 minutely data from the wirelessTag sensors and calculated the median temperature for each hour and determined the indicated quantiles for each sensor (using the R functions 'aggregate' and 'quantile'). Inside includes data from 12 wirelessTag sensors spread across every room of the house. Outside is the data from the wirelessTag sensors in the cubby house, outside, and HRV intake. The water wall and door data are not included.
Monthly electricity data. We generated 553kWh, we used 380kWh, so we were net energy producers for the month (5.8kWh/day). Because we don't have batteries, we exported 321kWh and imported 148kWh.


