2021 February
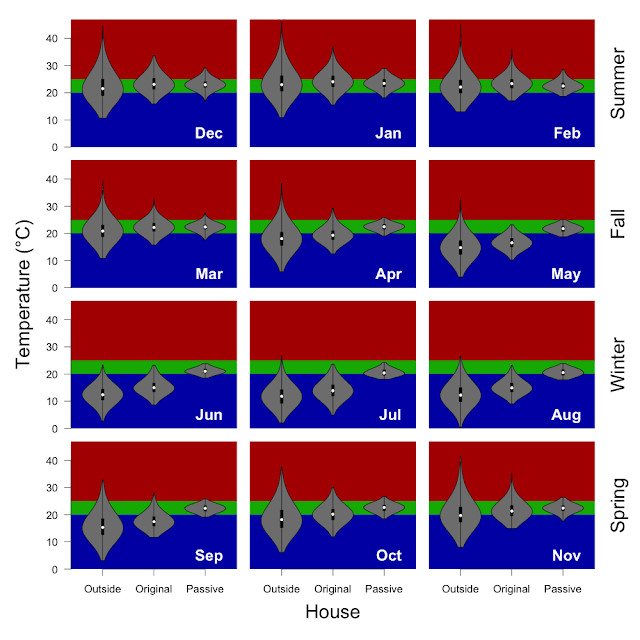
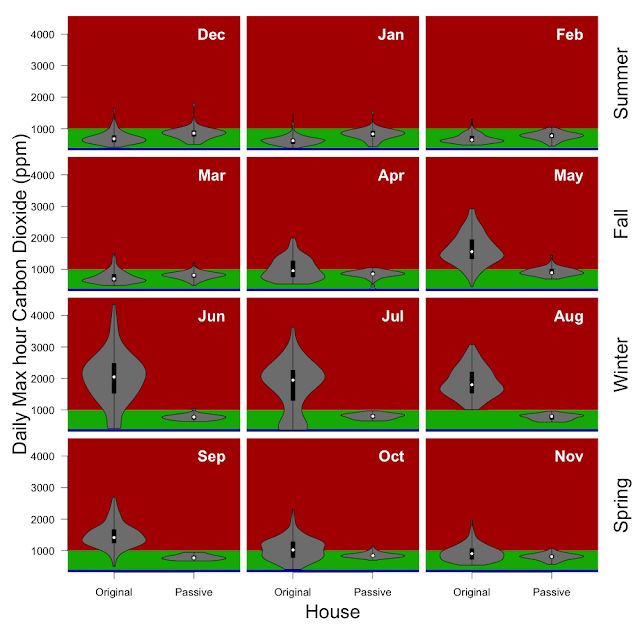
The summer has been quite wet and cool - especially relative to the very hot and dry 2020 - making it easier to keep the house temeprature in range without using the A/C. In February we ran the A/C on 11 days on a noon until 6pm schedule to take advantage of the solar production during that part of the day. If the high temperture of the day is less than ~ 30 °C then I try to remember to turn it off, but sometimes I don't always remember and the A/C will turn on but not actually do any cooling. The main source of cooling continues to be openning the windows during the cooler evening / nighttime hours. THe H/ERV is working well and we are soon to the end of our experimental period (I managed to convince them to continue in the hope of getting some more hot day data, but the weather wasn't cooperative! Feb is back to school month in Oz, so the children are in school and typically one adult is at work while the other is working from home most days.
| Inside / Outside | % < 20 °C | % 20 - 25 °C | % > 25 °C |
|---|---|---|---|
| inside | 0% | 98% | 2% |
| outside | 49% | 37% | 14% |
Methods: I have taken the 5 minutely data from the wirelessTag sensors and calculated the median temperature for each hour and determined the proportion of hours falling inside of the 20 - 25 °C target temperature (using the R functions 'aggregate' and 'hist'). Inside includes data from 12 wirelessTag sensors spread across every room of the house. Outside is the data from the wirelessTag sensors outside near the cubby house and HRV intake. The water wall and door data are not included.
| Inside / Outside | Min | 5% | 25% | Median | 75% | 95% | Max |
|---|---|---|---|---|---|---|---|
| inside | 20 | 21 | 22 | 22 | 23 | 25 | 26 |
| outside | 14 | 16 | 18 | 20 | 22 | 28 | 33 |
Methods: I have taken the 5 minutely data from the wirelessTag sensors and calculated the median temperature for each hour and determined the indicated quantiles for each sensor (using the R functions 'aggregate' and 'quantile'). Inside includes data from 12 wirelessTag sensors spread across every room of the house. Outside is the data from the wirelessTag sensors in the cubby house, outside, and HRV intake. The water wall and door data are not included.
Monthly electricity data. We generated 411kWh, we used 295kWh, so we were net energy producers for the month (4.2kWh/day). Because we don't have batteries, we exported 250kWh and imported 134kWh. We now have a complete year worth of solar data, so expect a summary post on that once my work settles down a little bit.


