2025 April
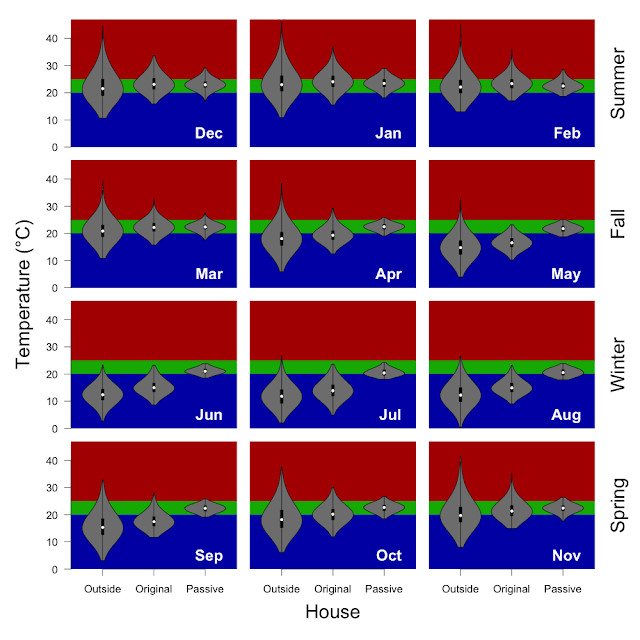
April had a decidely autumnal feel (median temperature 18 °C). Outside temperatures ranged from 11 to 31 °C, while inside we were a comfortable 19 to 24 °C. The HRV was in the cooling season until the last couple days of the month and the split system was not used during April. At the start of the month we were openning windows in the evening as primary means of cooling house, but not at the end of the month.
Temperature from inside and outside the house as the percentage of hours in 0.5 °C bins. I've scaled the temperature in hope that I will be able to use the temperature range for all months.
Methods: I have taken the 5 minutely data from the wirelessTag sensors and calculated the median temperature for each hour and determined the proportion of hours falling inside of the 20 - 25 °C target temperature (using the R functions 'aggregate' and 'hist'). Inside includes data from the wirelessTag sensors spread across nearly every room of the house. Outside is the data from the wirelessTag sensors outside near the cubby house and HRV intake. The water wall and door data are not included.
Energy production and consumption: 1. total daily consumption daily energy production, 2. daily net energy production, and 3. energy independence (which is the percentage of our daily consumption that is met directly by our solar panels).
The energy graphs this month as a bit rough due to an ongoing issue with the way my Enphase solar and battery systems are both reporting data (resulting in double counting production and consumption). I've done a quick back of the envelope attempt to correct this, but I'll also post some meter based data in a couple days when it becomes available.


