2025 July
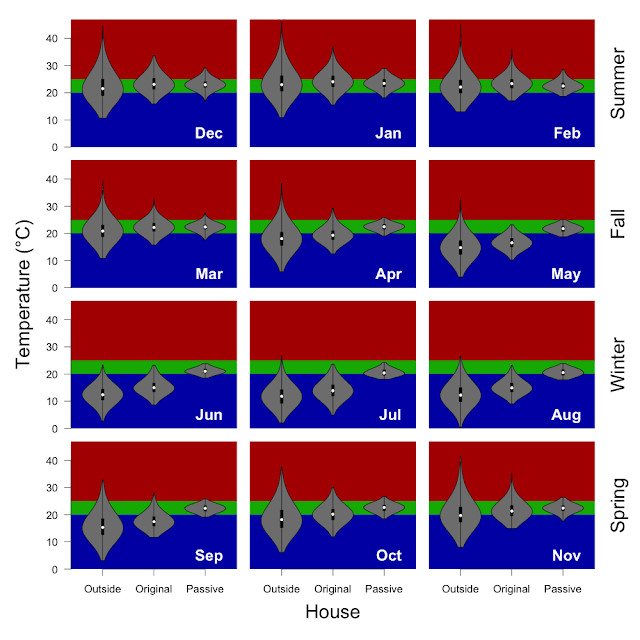
July was decidely wintery (median temperature 11 °C). Outside temperatures ranged from 1.5 to 20 °C, while inside we were a comfortable 18 to 22 °C. The HRV was in the heating season and the split system was set to heat to 20 °C. Now that we have solar house batteries we no longer need to schedule the split system to run during solar generation as we have done prevously. We have made a decision to keep the house above the WHO recommended 18 °C rather than the passive house standard of 20 °C.
Temperature from inside and outside the house as the percentage of hours in 0.5 °C bins. I've scaled the temperature in hope that I will be able to use the temperature range for all months.
Methods: I have taken the 5 minutely data from the wirelessTag sensors and calculated the median temperature for each hour and determined the proportion of hours falling inside of the 20 - 25 °C target temperature (using the R functions 'aggregate' and 'hist'). Inside includes data from the wirelessTag sensors spread across nearly every room of the house. Outside is the data from the wirelessTag sensors outside near the cubby house. The water wall data are not included.
Energy production and consumption: 1. total daily consumption and solar production, 2. daily net energy production (energy produced - consumed), 3. energy independence (1 - (imported / consumed energy)), and 4. solar offset (energy produced / consumed).
Some notes about the energy plots... Currently the batteries are configured to minimise our electrical cost, which means ensuring that we don't import electricity during the peak demand period. That means that we still import and export electricity to/from the grid, even on days when we generate as much as we need. It is also possible to have negative independence when we import more than we consume due to charging batteries and averaging across days. So far the real world efficiency of the batteries has been ~ 80%.


