2026 July
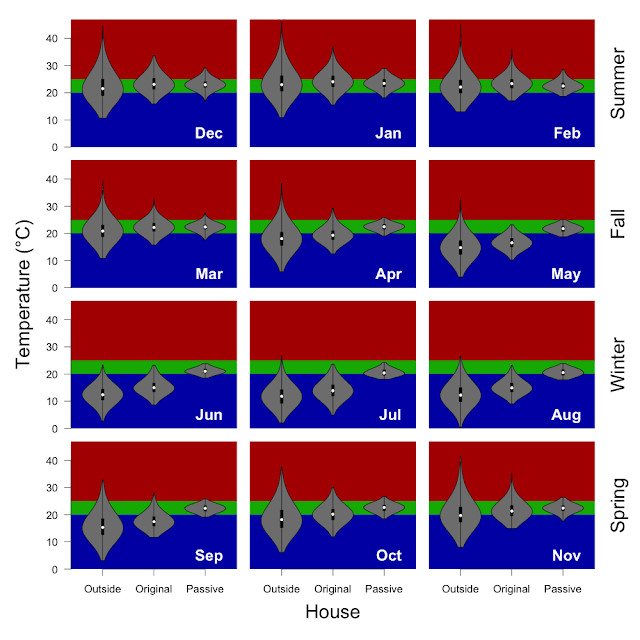
July was definitely winter. Outside temperatures ranged from 3 to 21 °C (median temperature 12 °C), while inside we were a comfortable 19 to 23 °C (median 21 °C). The HRV was in the heating season, and the split system set to 22 °C heating. We have new solar panels, so production was up, so not sure exactly how the scale will evolve on the electricity plots. We are missing 5 days of electricity data this month.
Temperature from inside and outside the house as the percentage of hours in 0.5 °C bins. I've scaled the temperature in hope that I will be able to use the temperature range for all months. We have made a decision to keep the house above the WHO recommended 18 °C rather than the passive house standard of 20 °C.

Methods: I have taken the 5 minutely data from the wirelessTag sensors and calculated the median temperature for each hour and determined the proportion of hours falling inside of the 20 - 25 °C target temperature (using the R functions 'aggregate' and 'hist'). Inside includes data from the wirelessTag sensors spread across nearly every room of the house. Outside is the data from the wirelessTag sensors outside near the cubby house. The water wall data are not included.
Energy production and consumption: 1. total daily consumption and solar production, 2. daily net energy production (energy produced - consumed), 3. energy independence (1 - (imported / consumed energy)).

Some notes about the energy plots... Currently the batteries are configured to self consumption, which means we import / export electricity as needed, but use solar / batteries if possible. The batteries will also top up from the grid when weather (including fire) warnings are issued to ensure that the batteries are full should the gird power go down.