Posts

Showing posts from June, 2021

The old house... and some musings on energy usage.
Image
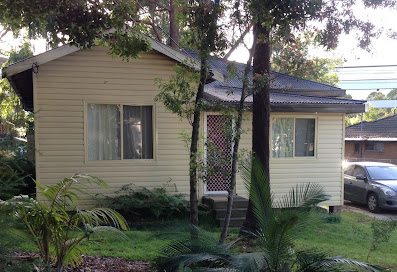
In response to the recent posts on temperature and carbon dioxide in the old house some have asked if it was in fact a tent... so I thought I would share some information on our old house. It was a lot like many of the houses that still exist in Thornleigh. I don't know the year it was built, but it was probably built between WWI and WWII, but had been gutted and renovated circa 1994 (based on the manufacture date printed back of the dry wall).  Originally it would have been two large front rooms and two smaller rooms in the rear with a central hallway plus a front and back porch. Very soon after construction an additional large room was added on the north side of the hallway (as we took the old house down you could see where the window had been). Both porches were filled in and the floors raised to the level of the house during the renovations. The floor plan consisted of 3 bedrooms, a living room, a kitchen/eating area, a bathroom, a laundry closet and a hallway. The total floo...
Carbon dioxide (Old vs. New)

Image
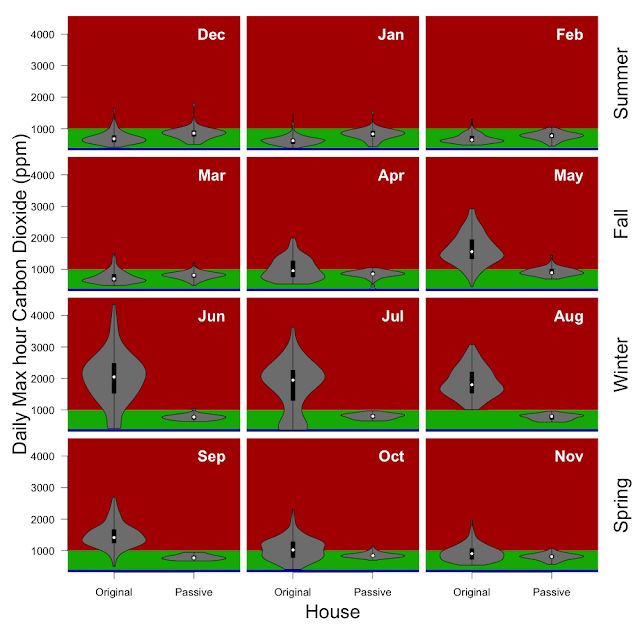
I one of the things I've noticed is the carbon dioxide levels in our passive house compared to our old house which had plenty of draughts but no ventilation aside from a bathroom exhaust fan.  So I've used the NetAtmo carbon dioxide data collected every 5 minutes since October 2012 to quantifiy the differences.  I only have a single sensor located in the respective living room of each house.  I averaged the raw measurements to get hourly averages.  Because I most interested in peak carbon dioxide - I've taken the maximum hourly average for each day. This ends up being 2,192 days from the original house, 615 days from the passive house. I've left the rental house out of this comparison, but it was disturbing like the original house despite being ~ 20 years old. By way of standards: 420ppm is typical CO2 level outside, less than ~ 1000ppm is considered to be good, levels greater than 2000ppm are often associated with headaches and drowsiness. The key take-home mes...

Temperature (Out vs. Old vs. New)

Image
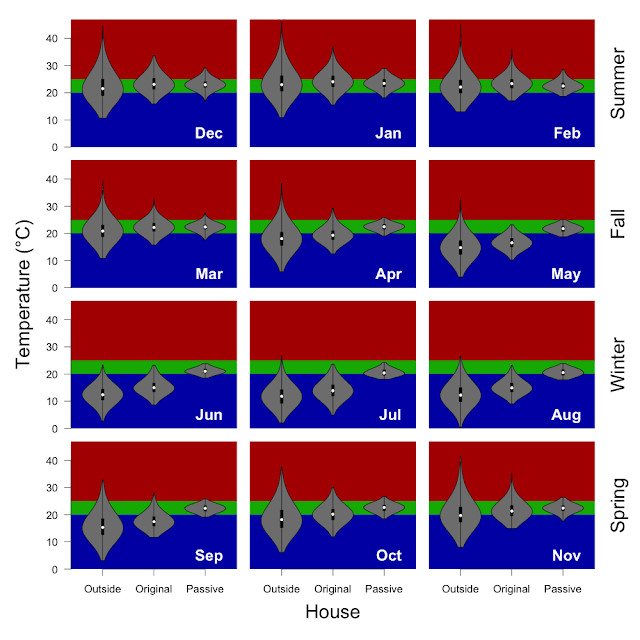
I have fielded more than a few questions about the temperature of our passive house versus the temperature of the house that we lived in prior (on the same lot).  So I've used the data I had on hand which is temperature (°C) recorded every 5 minutes over since October 2012. For the sake of consistency I am only using the NetAtmo sensors that I have had for that entire period. So I only have one outside sensor and one inside sensor located in the the respective living room. The outside sensor moved around a bit, but it should be good enough.  I've converted those measurements to hourly averages.  This ends up being ~ 66,955 hours to play with (52,232 hours from the original house, 14,723 hours from the passive house). I've left the rental house out of this comparison, but it was disturbing like the original house despite being ~ 20 years old. The key take-home messages: The passive house a much less variation in temperature than the original house (or outside).  ...

Fall...

 A new format, now that we have longer periods with comparable data... a work in progres... Percentage of hours in below, within, above the 20 - 25 °C target temperature range for the season (inside). Year % < 20 °C % 20 - 25 °C % > 25 °C 2020 5% 95% 0% 2021 5% 94% 1% Quantile inside temperatures (°C) for the season. Year Min 5% 25% Median 75% 95% Max 2020 19 20 21 22 23 24 25 2021 18 20 22 22 23 24 26 Quantile outside temperatures (°C) for the season. Year Min 5% 25% Median 75% 95% Max 2020 4 9 13 16 20 25 38 2021 4 8 13 17 19 24 34 Energy Use (kWh) for the season. Year Produced Consumed Export Import Net 2020 12.7 12.7 6.6 6.5 0.0 2021 12.6 11.1 7.2 5.7 1.4 Methods: I have taken the 5 minutely data from the wirelessTag sensors and calculated the median temperature for each hour and determined the proportion of hours falling inside of the 20 - 25 °C target temperature (using the R functions 'aggregate' and 'hist...

2021 May

Fall came and went, and we are definielty into the heating season now. In May the split system ran as a heater for the second half of the month from ~9:45am until 3:30pm, scheduled to take advantage of the solar production during that part of the day. This is mainly because I am experimenting. THe HRV is working well and doing a great job of keeping the house in the comfort zone. May was a "normal month" typically one adult is at work while the other is working from home, but we are increasingly spending days in the office. In theory running the split system the way I did this year might have pushed up our electrical consumption sightly, but we sill used less than last May (420kWh used in 2020 vs. 359kWh this year). The change in usage is likely due to not having fewer people at home in 2021 vs. 2020. We are doing slightly better at using our own solar (rather than importing power from the grid) than last year, but that is due to optimising the time of day that the hot water...