2021 May
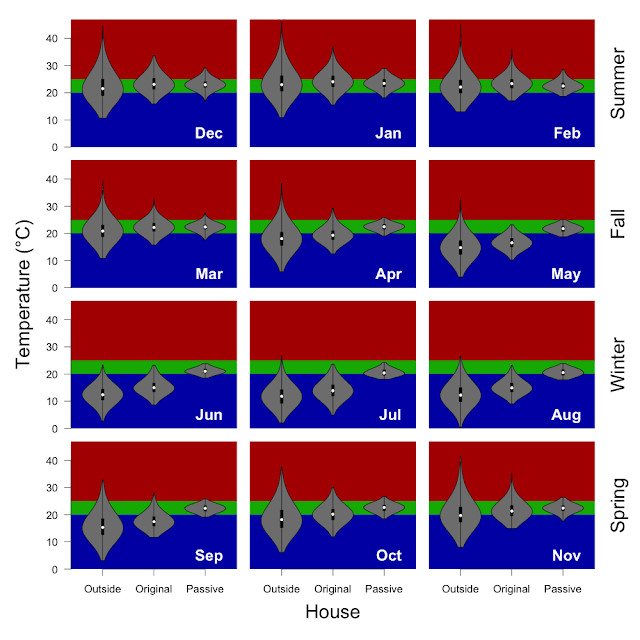
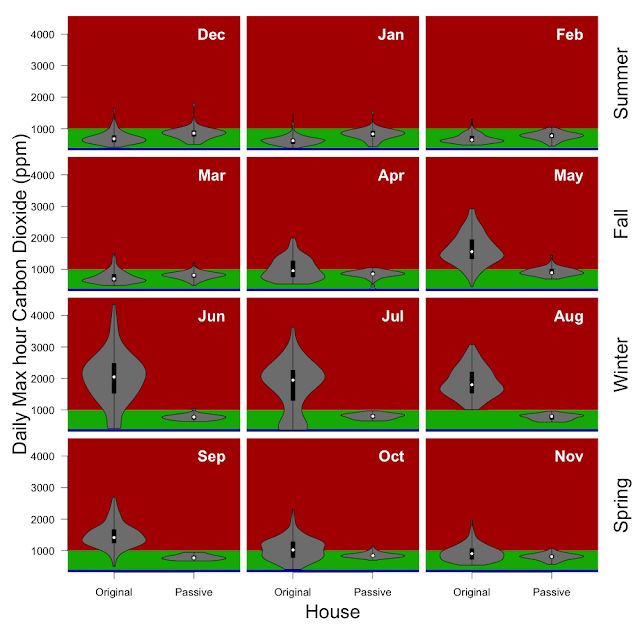
Fall came and went, and we are definielty into the heating season now. In May the split system ran as a heater for the second half of the month from ~9:45am until 3:30pm, scheduled to take advantage of the solar production during that part of the day. This is mainly because I am experimenting. THe HRV is working well and doing a great job of keeping the house in the comfort zone. May was a "normal month" typically one adult is at work while the other is working from home, but we are increasingly spending days in the office.
In theory running the split system the way I did this year might have pushed up our electrical consumption sightly, but we sill used less than last May (420kWh used in 2020 vs. 359kWh this year). The change in usage is likely due to not having fewer people at home in 2021 vs. 2020. We are doing slightly better at using our own solar (rather than importing power from the grid) than last year, but that is due to optimising the time of day that the hot water system runs.
| Inside / Outside | % < 20 °C | % 20 - 25 °C | % > 25 °C |
|---|---|---|---|
| inside | 11% | 89% | 0% |
| outside | 94% | 6% | 0% |
Methods: I have taken the 5 minutely data from the wirelessTag sensors and calculated the median temperature for each hour and determined the proportion of hours falling inside of the 20 - 25 °C target temperature (using the R functions 'aggregate' and 'hist'). Inside includes data from 12 wirelessTag sensors spread across every room of the house. Outside is the data from the wirelessTag sensors outside near the cubby house and HRV intake. The water wall and door data are not included.
| Inside / Outside | Min | 5% | 25% | Median | 75% | 95% | Max |
|---|---|---|---|---|---|---|---|
| inside | 18 | 19 | 21 | 22 | 23 | 24 | 25 |
| outside | 4 | 7 | 11 | 14 | 17 | 20 | 24 |
Methods: I have taken the 5 minutely data from the wirelessTag sensors and calculated the median temperature for each hour and determined the indicated quantiles for each sensor (using the R functions 'aggregate' and 'quantile'). Inside includes data from 12 wirelessTag sensors spread across every room of the house. Outside is the data from the wirelessTag sensors in the cubby house, outside, and HRV intake. The water wall and door data are not included.
Monthly electricity data. We generated 358kWh, we used 359kWh, so we were net energy users for the month (35Wh/day). Because we don't have batteries, we exported 190.4kWh and imported 191.5kWh... As you can see it was quote close at it is all in the decimals (an import of 1.1kWh over the month is 35Wh/day [Watts not kiloWatts])... or about half a dishwasher cycle which isn't bad.


