Posts

Showing posts from 2021

2021 November (+ Spring)

Image
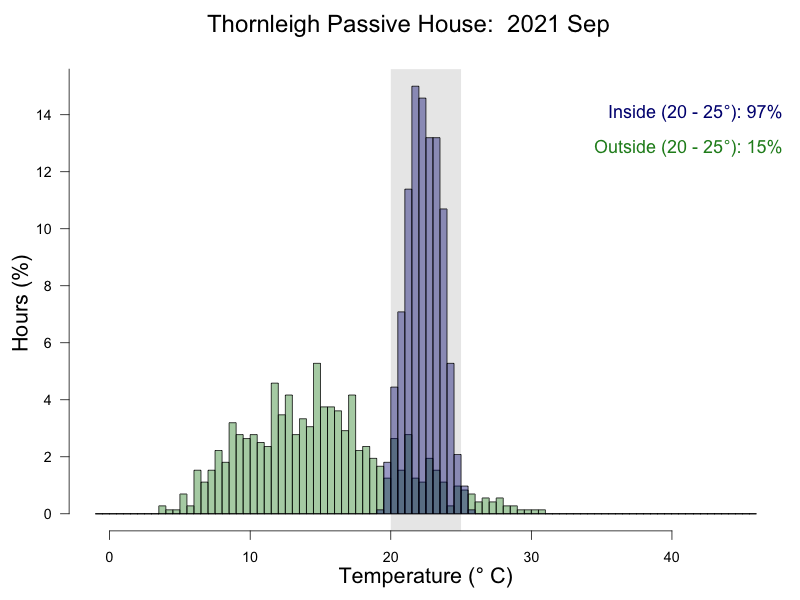
New normal version 2.0 for November: kids in School and the parents working from home ~4 days per week. The split system was off for the entire month and the HRV slid in and out of 'cooling season' and neutral modes of operation more times that I could keep track of. The HRV did a great job of keeping the house in the comfort zone (if I could set the cooling season trigger in half degree increments we would have bit in range a bit more). It was an abnormally wet and cool November. Temperature from inside and outside the house as the percentage of hours in 0.5 °C bins. I've set the temperature range in hopes that they will be comparable across months. Methods: I have taken the 5 minutely data from the wirelessTag sensors and calculated the median temperature for each hour and determined the proportion of hours falling inside of the 20 - 25 °C target temperature (using the R functions 'aggregate' and 'hist'). Inside includes data from the wirelessTag sen

2021 October

Image
Lockdown version 2.0 came to an end at the very end of October. The split system was off for most of the month (six days with heat and one day with cooling) and the HRV slid in and out of 'cooling season' and neutral modes of operation more times that I could keep track of. The HRV did a great job of keeping the house in the comfort zone. The kids went back to school for the last week of the month and the parents are were in the office a few days at the end of the month, but we were mostly at home... again. Temperature from inside and outside the house as the percentage of hours in 0.5 °C bins. I've scaled the temperature in hopes that they will be comparable across months. Methods: I have taken the 5 minutely data from the wirelessTag sensors and calculated the median temperature for each hour and determined the proportion of hours falling inside of the 20 - 25 °C target temperature (using the R functions 'aggregate' and 'hist'). Inside includes data

2021 September

Image
Spring is underway, but so is lockdown version 2.0. The flowers are out, but we are not. In September the split system was off for most of the month and the HRV slid in and out of 'heating season' and neutral modes of operation more times that I could keep track of. The HRV is working well and doing a great job of keeping the house in the comfort zone. During September we were all at home in our second significant COVID lockdown (and going a bit crazy). I continuing the graphic heavy format. Temperature from inside and outside the house as the percentage of hours in 0.5 °C bins. I've scaled the temperature in hopes that they will be comparable across months. Methods: I have taken the 5 minutely data from the wirelessTag sensors and calculated the median temperature for each hour and determined the proportion of hours falling inside of the 20 - 25 °C target temperature (using the R functions 'aggregate' and 'hist'). Inside includes data from the wire

Sustainable House Day 2021 & Year 2 - numbers update...

[ In progress ] With the anniversary of moving in and sustainable house day coming up... I need to start running some numbers. I am also creating my annual index to posts so that I can find them when doing sustainable house day stuff! Power generation and usage... June 2021 old house and energy April 2021 energy musings (including battery) Water usage... Aug 2021 water update Dec 2020 HRV thoughts... Aug 2021 second guessing ERV Dec 2020 HRV in Sydney post Temperature & CO2... June 2021 Temperature analysis & plots June 2021 CO2 analysis & plots Air tightness July 2021 update

Water update...

Image
It has been a while since I've done a water update... Sydney Water: based on data from the last 8 water bills we have used 122kL over 646 days or an average of 189L/day. We have four people living here so individually we average 47 L/day. Comparing those numbers is a little tricky. Sydney Water data indicates that an average dwelling uses 623L/day . They also provide water efficiency targets by season , number of people and property size. For our property the comparison is > 900m² with 4 people. Sydney Water efficiency targets by quarter (L/day). Quarter Sydney Water Target TPH actual Aug - Oct 556 253 Nov - Jan 572 195 Feb - Apr 576 187 May - Jul 535 167 Despite by best intentions I have not yet put into place the software to measure the rain water tank usage directly, but I do have a system that measures the water height in the tank (Vegetronics) and a NetAtmo rain gauge.  The rainwater tank sensor reports full slightly below the actual full mark, so there

2021 August (+ Winter)

Image
Winter is done, but lockdown version 2.0 is not. In August the split system ran as a heater for most of the month from ~9:45am until 3:30pm, scheduled to take advantage of the solar production during that part of the day. On cooler nights we kept it on set to 19 °C. The HRV is working well and doing a great job of keeping the house in the comfort zone, although the gound floor is consistently a few degrees cooler than the top floor. During August we were all at home in our second significant COVID lockdown (and going a bit crazy). I am going to change to a more graphic heavy format. Temperature from inside and outside the house as the percentage of hours in 0.5 °C bins. I've scaled the temperature in hopes that they will be comparable across months. Methods: I have taken the 5 minutely data from the wirelessTag sensors and calculated the median temperature for each hour and determined the proportion of hours falling inside of the 20 - 25 °C target temperature (using the R f

Two years...

... Two years! Wow, the time flies! I've picked up some new wireless tag sensors that can plug in to a USB wall plug and will use fewer button batteries. I am still working to get all those placed, but I've got one in the uninsulated detached garage and one in the study again. I am probably overdue to explain the gradual changes to the monitoring system, but that is not this post. I did a day of calibration (August 11th) where I pulled all the sensors and put them in one place so that I could make sure that they all had the same sense of temperature and humidity. They were all fairly close, but I tweaked individual sensor calibrations by up to ~0.3 °C for some sensors. The Netatmo CO₂ sensors were fairly far out since they recalibrate to 400ppm based on the assumption that CO₂ levels drop to 400ppm at least once a week. Normally that would not be an issue, but lockdown. Yes, one of the lesser appreciated impacts from the lockdown is that my CO₂ sensors were underestimatin

Second guessing ERV

Image
I've been a bit busy lately, so I've not had a chance to run the formal numbers... and there are a lot of variables at play, but... My partner and I have noticed that the house is a lot drier this winter than it was last winter when we were alternating the HRV and ERV cores. A glance at the data suggests that the ERV does what it is supposed to do and helps keep moisture in the house during the winter heating period. I am planning to have a look at the moisture levels in the house between the ERV and HRV periods. I've attached a summary plot from the our system which does hit at what I am talking about... Compare the May / June period from 2020 and 2021. Just peeking at the graph it looks like the ERV maintains a much higher humidity (but still in the good range) than the HRV core with supply values ~ 10g/Kg for the ERV core versus 6-7g/Kg for the HRV core. In the most comparable time last year we were not at home 100% of the time like we have been this year. So maybe a hu

2021 July

Winter is here, and so is lockdown version 2.0. In July the split system ran as a heater for most of the month from ~9:45am until 3:30pm, scheduled to take advantage of the solar production during that part of the day. On cooler nights we kept it on set to 19 °C. The HRV is working well and doing a great job of keeping the house in the comfort zone, although the gound floor is consistently a few degrees cooler than the top floor. During July we were all at home in our second significant COVID lockdown (and going a bit crazy). Percentage of hours in below, within, above the 20 - 25 °C target temperature range for the month. Inside / Outside % < 20 °C % 20 - 25 °C % > 25 °C inside 39% 61% 0% outside 99% 1% 0% Methods: I have taken the 5 minutely data from the wirelessTag sensors and calculated the median temperature for each hour and determined the proportion of hours falling inside of the 20 - 25 °C target temperature (using the R functions 'aggregate' and

Air tightness....

Image
I get a reasonable number of questions about air tightness which is one of the key passive house principles. Australia has no air tightness requirements...  despite some solid suggestions  and some solid International examples . The UK requires new houses to have < 10 ACH50. The USA Department of Energy has a Zero Energy Ready Home national program certification that outlines required ACH50 values ranging from 1.5 to 3 depending on climate zone. Certified Passive Houses are required to have < 0.6 ACH50. Air tightness is measured using a blower door test. Using a calibrated fan and pressure gauges they increase and decrease the pressure in the house relative to outside measuring how much air has to be pumped in or out to maintain the desired pressure at a range of pressures. From these measurements they determine how much air leaks in when the house is 50Pa lower than outside and how much air leaks out when the house is 50Pa higher than outside. To account for the fact that house

2021 June

Winter is here and we are definielty into the heating season now. In June the split system ran as a heater for most of the month from ~9:45am until 3:30pm, scheduled to take advantage of the solar production during that part of the day. The HRV is working well and doing a great job of keeping the house in the comfort zone, although the gound floor is consistently a few degrees cooler than the top floor. June started as "normal month" typically one adult is at work while the other is working from home, but we ended up all at home in our second significant COVID lockdown. Percentage of hours in below, within, above the 20 - 25 °C target temperature range for the month. Inside / Outside % < 20 °C % 20 - 25 °C % > 25 °C inside 19% 81% 0% outside 100% 0% 0% Methods: I have taken the 5 minutely data from the wirelessTag sensors and calculated the median temperature for each hour and determined the proportion of hours falling inside of the 20 - 25 °C target tem

The old house... and some musings on energy usage.

Image
In response to the recent posts on temperature and carbon dioxide in the old house some have asked if it was in fact a tent... so I thought I would share some information on our old house. It was a lot like many of the houses that still exist in Thornleigh. I don't know the year it was built, but it was probably built between WWI and WWII, but had been gutted and renovated circa 1994 (based on the manufacture date printed back of the dry wall).  Originally it would have been two large front rooms and two smaller rooms in the rear with a central hallway plus a front and back porch. Very soon after construction an additional large room was added on the north side of the hallway (as we took the old house down you could see where the window had been). Both porches were filled in and the floors raised to the level of the house during the renovations. The floor plan consisted of 3 bedrooms, a living room, a kitchen/eating area, a bathroom, a laundry closet and a hallway. The total floo

Carbon dioxide (Old vs. New)

Image
I one of the things I've noticed is the carbon dioxide levels in our passive house compared to our old house which had plenty of draughts but no ventilation aside from a bathroom exhaust fan.  So I've used the NetAtmo carbon dioxide data collected every 5 minutes since October 2012 to quantifiy the differences.  I only have a single sensor located in the respective living room of each house.  I averaged the raw measurements to get hourly averages.  Because I most interested in peak carbon dioxide - I've taken the maximum hourly average for each day. This ends up being 2,192 days from the original house, 615 days from the passive house. I've left the rental house out of this comparison, but it was disturbing like the original house despite being ~ 20 years old. By way of standards: 420ppm is typical CO2 level outside, less than ~ 1000ppm is considered to be good, levels greater than 2000ppm are often associated with headaches and drowsiness. The key take-home messages: T

Temperature (Out vs. Old vs. New)

Image
I have fielded more than a few questions about the temperature of our passive house versus the temperature of the house that we lived in prior (on the same lot).  So I've used the data I had on hand which is temperature (°C) recorded every 5 minutes over since October 2012. For the sake of consistency I am only using the NetAtmo sensors that I have had for that entire period. So I only have one outside sensor and one inside sensor located in the the respective living room. The outside sensor moved around a bit, but it should be good enough.  I've converted those measurements to hourly averages.  This ends up being ~ 66,955 hours to play with (52,232 hours from the original house, 14,723 hours from the passive house). I've left the rental house out of this comparison, but it was disturbing like the original house despite being ~ 20 years old. The key take-home messages: The passive house a much less variation in temperature than the original house (or outside).  In the summe

Fall...

 A new format, now that we have longer periods with comparable data... a work in progres... Percentage of hours in below, within, above the 20 - 25 °C target temperature range for the season (inside). Year % < 20 °C % 20 - 25 °C % > 25 °C 2020 5% 95% 0% 2021 5% 94% 1% Quantile inside temperatures (°C) for the season. Year Min 5% 25% Median 75% 95% Max 2020 19 20 21 22 23 24 25 2021 18 20 22 22 23 24 26 Quantile outside temperatures (°C) for the season. Year Min 5% 25% Median 75% 95% Max 2020 4 9 13 16 20 25 38 2021 4 8 13 17 19 24 34 Energy Use (kWh) for the season. Year Produced Consumed Export Import Net 2020 12.7 12.7 6.6 6.5 0.0 2021 12.6 11.1 7.2 5.7 1.4 Methods: I have taken the 5 minutely data from the wirelessTag sensors and calculated the median temperature for each hour and determined the proportion of hours falling inside of the 20 - 25 °C target temperature (using the R functions 'aggregate' and 'hist&#

2021 May

Fall came and went, and we are definielty into the heating season now. In May the split system ran as a heater for the second half of the month from ~9:45am until 3:30pm, scheduled to take advantage of the solar production during that part of the day. This is mainly because I am experimenting. THe HRV is working well and doing a great job of keeping the house in the comfort zone. May was a "normal month" typically one adult is at work while the other is working from home, but we are increasingly spending days in the office. In theory running the split system the way I did this year might have pushed up our electrical consumption sightly, but we sill used less than last May (420kWh used in 2020 vs. 359kWh this year). The change in usage is likely due to not having fewer people at home in 2021 vs. 2020. We are doing slightly better at using our own solar (rather than importing power from the grid) than last year, but that is due to optimising the time of day that the hot water

IEA - 2050 Report

 The International Energy Agency is not known as a hot bed of tree huggers. It has been one of the oft quoted sources of the Australian Liberal (they are conservative) Party's thoughts about energy policy... but they have dropped a new report outlining the viable pathway to net zero emissions by 2050 . It is a huge document with lots of stuff in it, and I am not an expert in these things... but I consider myself a reasonably sensible and intelligent person... and interested in the future of the human species. So in the context of this blog I wanted to highlight a few things it mentions in terms of our built environment. By 2030 - all new buildings need to be zero-carbon-ready . That is quite soon! I would be curious as to our current level, but it is almost certainly a very small proportion and not increasing fast enough to meet this target. By 2040 - 50% of existing buildings need to be retrofitted to zero-carbon-ready levels .  "Around 2.5% of existing residential build

FAQ on building and living in a certified passive house...

I went to the Australian Passive House Association sponsored open house at Asquith Passivehaus  on Friday and it was great fun to catch up with about a hundred people into passive houses.  At these gatherings if people discover that I live in a passive house then they always ask about the money and the stress associated with choosing to build a certified passive house. Stress associated with the decision to build a certified passive house: Deciding to build a house is a big decision. The choice to build a passive house was the least stressful or difficult choice we made when building our new home. It doesn't dictate a particular style for the house - it is about meeting an efficiency standard - which can stress out your architect and builder, but the the owner! Deciding to build a certified passive house made the process less stressful because of the added certainty of how our new house would perform was so much less... someone with far more knowledge than I possess was going to d

2021 April

Fall is here, and we are just about into the temperatures where the HRV's job is to keep things warm. In April we ran the split as a heater on 6 days on a 10:30am until 3pm schedule to take advantage of the solar production during that part of the day. This is mainly because I am experimenting. THe HRV is working well and doing a great job of keeping the house in the comfort zone. April is a "normal month" typically one adult is at work while the other is working from home, but we are increasingly spending days in the office. Percentage of hours in below, within, above the 20 - 25 °C target temperature range for the month. Inside / Outside % < 20 °C % 20 - 25 °C % > 25 °C inside 0% 100% 0% outside 79% 21% 0% Methods: I have taken the 5 minutely data from the wirelessTag sensors and calculated the median temperature for each hour and determined the proportion of hours falling inside of the 20 - 25 °C target temperature (using the R functions 'aggr

Solar reflections

Image
Our solar has been installed and generating for a year now... and enphase is really good at making data available. So I've been looking at our solar data and playing some what if games. For these purposes I am taking our electicity data from the enphase monthly reports - which do not include our garage power usage due to the way the our house is wired, but that usage is quite trivial so I am going to ignore it. The enphase system reports data (power generated, power imported, power consumed and power exported) in 15 minute intervals. I've include all the data which means I've got a little over 13 months of data to work with. Keep in mind that we have a great big tree on the east side of our house that significantly shades our solar panels for most of the morning, and a decent tree on the west that provides some partial shade especially in the later afternoon. Overall summary - daily average by month (kWh). Month Produced Consumed Exported Imported Net Jan 16.0

2021 March

Fall is here, but we just ticked out of the HRV's need to cool zone at the end of March. In March we ran the A/C on 4 days on a noon until 6pm schedule to take advantage of the solar production during that part of the day. The main source of cooling continues to be openning the windows during the cooler evening / nighttime hours, although towards the end of March we've not been doing much nighttime ventilation. THe HRV is working well and we done with the experimental period (I've sent the ERV core back to FanTech)! March is a "normal month" typically one adult is at work while the other is working from home, but we are increasingly spending days in the office. Percentage of hours in below, within, above the 20 - 25 °C target temperature range for the month. Inside / Outside % < 20 °C % 20 - 25 °C % > 25 °C inside 0% 84% 16% outside 34% 25% 41% Methods: I have taken the 5 minutely data from the wirelessTag sensors and calculated the median t

2021 February

The summer has been quite wet and cool - especially relative to the very hot and dry 2020 - making it easier to keep the house temeprature in range without using the A/C. In February we ran the A/C on 11 days on a noon until 6pm schedule to take advantage of the solar production during that part of the day. If the high temperture of the day is less than ~ 30 °C then I try to remember to turn it off, but sometimes I don't always remember and the A/C will turn on but not actually do any cooling. The main source of cooling continues to be openning the windows during the cooler evening / nighttime hours. THe H/ERV is working well and we are soon to the end of our experimental period (I managed to convince them to continue in the hope of getting some more hot day data, but the weather wasn't cooperative! Feb is back to school month in Oz, so the children are in school and typically one adult is at work while the other is working from home most days. Percentage of hours in be

Around the web...

Might recognise some clips in this video about passive houses...

2021 January

A new year... The hot weather is alternating with wet and cool weather making it easier to keep the house temeprature in range without using the A/C. Percentage of hours in below, within, above the 20 - 25 °C target temperature range for the month. Inside / Outside % < 20 °C % 20 - 25 °C % > 25 °C inside 1% 90% 9% outside 43% 33% 24% Methods: I have taken the 5 minutely data from the wirelessTag sensors and calculated the median temperature for each hour and determined the proportion of hours falling inside of the 20 - 25 °C target temperature (using the R functions 'aggregate' and 'hist'). Inside includes data from 12 wirelessTag sensors spread across every room of the house. Outside is the data from the wirelessTag sensors outside near the cubby house and HRV intake. The water wall and door data are not included. Quantile temperatures (°C) for the month. Inside / Outside Min 5% 25% Median 75% 95% Max inside 20 21 22 23 24 25 27 outside

2020 December

The end of the calendar year! The revised scripts were helping with the turnaround time... now I just ahev to get the JSON interface to wirelesstags working. By way of a random COVID update... Holiday time, so everyone was home (and due to the latest outbreak we do mean home) for the last couple weeks of the year! The wet and cool weather hit us hitting our solar generation, but making it easier to keep the house temeprature in range without using the A/C. Percentage of hours in below, within, above the 20 - 25 °C target temperature range for the month. Inside / Outside % < 20 °C % 20 - 25 °C % > 25 °C inside 1% 98% 2% outside 53% 34% 12% Methods: I have taken the 5 minutely data from the wirelessTag sensors and calculated the median temperature for each hour and determined the proportion of hours falling inside of the 20 - 25 °C target temperature (using the R functions 'aggregate' and 'hist'). Inside includes data from 12 wirelessTag sensors sp